Interested in learning more about MTM? Checkout my Pluralsight course on Microsoft Test Manager.
This is part 2 of an Intro to MTM series. Here is part 1.
On the previous post, I introduced test planning with MTM. Today we are going to take a look at how you run and analyze your test cases. We start by moving to the “Test” tab at the top of MTM.
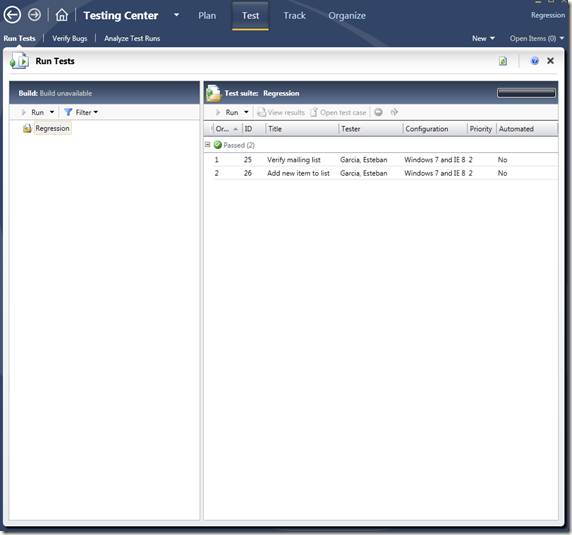
This screen shows us all our test suites that are marked as “in progress” and that have test cases under them. You can double-click on each test case to view its results, you can run your test case, mark it as blocked, or just open it up to edit it.
Running a Test case
We’ll start by clicking on “Run” in order to get the test case started. You are going to get a side-bar with the option to start your test case. This allows you to see your test steps on the left, while executing your test on the right-hand side. You are given the option to create a new action recording, which will later allow you to re-run your test without having to physically interact with your application. This is great for regression and (as I will show), for running multiple iterations of the same test. This action recording is also used if/when you want to turn your test into a Coded UI test.
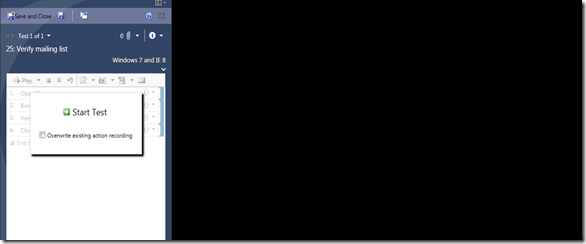
Once you click on “Start Test”, you get this:
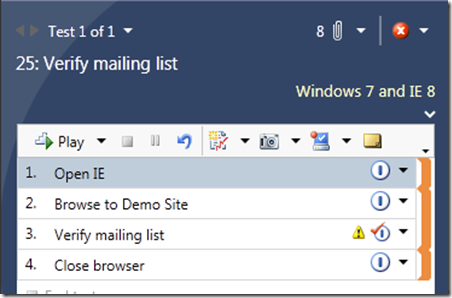
At this point, MTM is using all the settings that you set when you were planning in order to figure out what it should be gathering. If you click on the Attachments icon towards the top, you can see everything that is gathered. If you’ve previously made an action recording of this test plan, you can select the test steps that you want to automatically re-play and click on the “Play” button and MTM will execute all those steps for you. NOTE: Take your hands off the keyboard and mouse as this is happening! From here, you can generate a bug (which would be seen by a developer right away…no synchronizing required), you can take screenshots, environment snapshots, and also enter any test-run-specific notes.
On my previous post on planning, I showed you how to create parameters in order to create multiple iterations. This is how it shows up when you are running a test case:
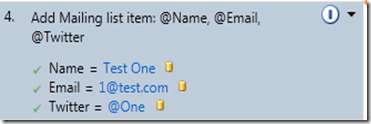
Notice the “databound” symbol next to each value, and also notice that the values came directly from the list of parameters that I entered at planning. When you are running your test case and you get to this step, all you have to do is put the cursor on each text box, paste (don’t need to copy), and the value will be automatically entered on your textbox and databound. This means that next time you run your test case (or the next iteration), MTM will know exactly what control should be populated with your values.
Test Results
Once you are done testing, you can take a look at test results. This is what the screen looks like:
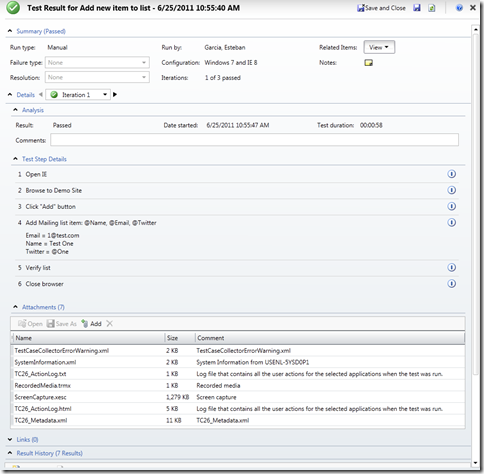
Here you can see all the steps that were executed, attachments (including recordings, screenshots, system info, etc), and iterate through iterations. You can also take a look at results from previous test runs. All this information is available to the entire team.
Verify Bugs
The “Test” tab has a second section called “Verify Bugs”. This is where you will see all the bugs that have been generated while running a test case. You can see bug status, who it’s assigned to, and other information. Clicking on the “Verify” button automatically starts the test case that generated the bug, so you don’t have to hunt around for a test case that you may have run a week or two ago. You are also able to create new bugs from this screen.

Analyze Test Runs
The third section of the “Test” tab allows you to see a list of all the tests that you run. Selecting each one takes you to an analysis screen where you can see the status and results of your tests.
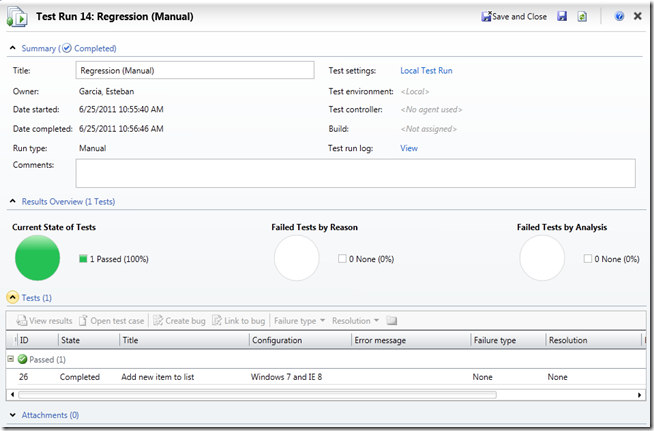
That concludes the “Test run” part. Next, we will cover test case management/organization, followed by Coded UI tests.
Interested in learning more about MTM? Checkout my Pluralsight course on Microsoft Test Manager.
